According to the EPA, the average person generates 4.51 pounds of waste per day. Have you ever wondered if you’re on the high or low end of the scale? You can find out by conducting a household waste audit.
I know, it doesn’t sound like fun digging through your garbage, but the best way to reduce your waste is to “know what you throw.” I’ll walk you through the process below in my own waste audit.
Reminder: Every waste audit is unique, so don’t expect your results to be the same as mine. Each household has different purchasing habits, and each community has different rules for garbage, recycling, and compost collection. I live in a two-person house with no children, in a city with a population of fewer than 200,000 people.

Step 1: Determine Your Timeline
First, decide how long you want to track your waste output. Since most communities collect garbage weekly, a seven-day waste audit is appropriate. For the most accurate audit, conduct your audit the day before collection day.
If your waste audit shows that you recycle more than you send to the landfill, switching to a smaller garbage cart may save you money.
In my example, my household generated two half-full bags of garbage and a half-full bag of recyclables over seven days. My household generates so little waste that we switched to a 48-gallon garbage cart. We could probably go two or three weeks before putting out the bin for pickup if not for the fact that the Arizona summer heat turns food waste into smelly compost very quickly.
Step 2: Prep Your Audit Space
Set down a tarp, newspaper, or other protective covering on the floor before you begin the audit. Ideally, you’ll find an indoor space so no garbage blows away, but opt for tiled floors instead of carpet so that any leaks can be cleaned up more easily.
Step 3: Organize Your Waste
You’re going to create four categories of waste:
- Items recyclable at the curb (paper, glass, metal, plastic bottles)
- Items recyclable, but not at the curb (plastic bags, electronics, batteries)
- Organic waste (yard waste, food, soiled paper)
- Everything else (non-recyclable packaging, diapers, straws)

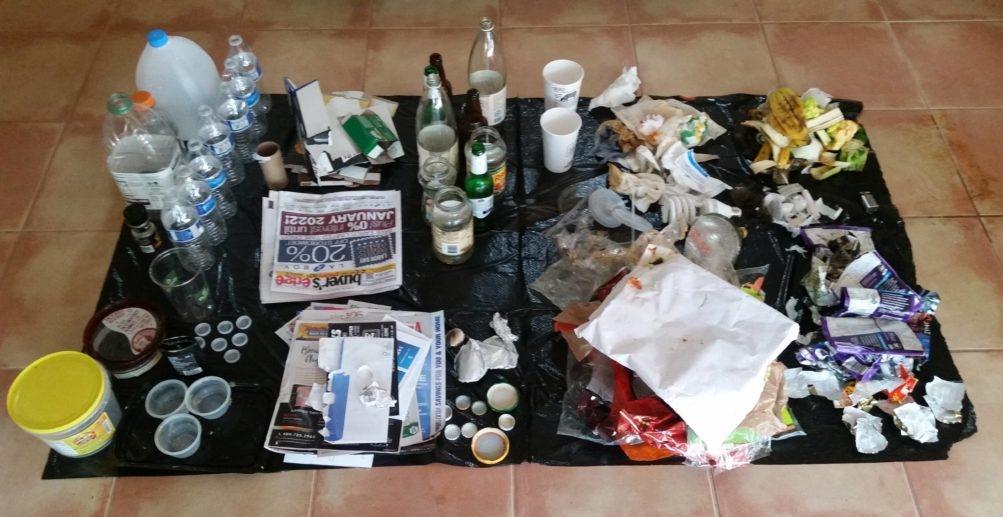
The contents of my household waste audit, with recyclable items on the left and waste that’s destined for the landfill on the right.
Step 4: Chart Your Audit Results
Once you have your waste sorted by category, create a chart that shows what you have. Here’s my chart:
| Cart Used | Material Type | Description | Quantity |
|---|---|---|---|
| Recycling | Glass | Glass bottles/jars | 9 |
| Recycling | Metal | Aluminum foil | 4 |
| Recycling | Metal | Metal lids | 8 |
| Recycling | Paper | Mixed paper | 22 |
| Recycling | Paper | Newsprint | 1 |
| Recycling | Paper | Paperboard boxes | 5 |
| Recycling | Paper | Paperboard tubes | 1 |
| Recycling | Plastic | Plastic bottles | 11 |
| Recycling | Plastic | Plastic containers | 7 |
| Recycling | Plastic | Plastic lids | 9 |
| Garbage | Food | Fruit/vegetable remains | 11 |
| Garbage | Medical | Bandages | 4 |
| Garbage | Paper | Paper cups | 2 |
| Garbage | Paper | Soiled paper | 8 |
| Garbage | Paper | Candy wrappers | 16 |
| Garbage | Plastic | Food packing bags | 27 |
| Garbage | Plastic | Plastic straws | 2 |
| Other | Hazardous | Batteries | 1 |
| Other | Hazardous | Lightbulbs | 2 |
You don’t have to be this detailed, but it certainly helps since not all paper and plastic are the same. In my case, garbage and recycling output is pretty even, with most of the garbage being single-use plastic packaging and food waste.
Now you have a pretty good idea of how much waste your household generates during a week. Of course, this doesn’t include items that you discard away from home. If you remember those items, consider adding them to your list for a more accurate audit.
Read part 2 of this series to learn how to make changes based on your home waste audit.
Editor’s note: Earth911 originally published this article on September 12, 2018.
The post The 411 on Conducting a Home Waste Audit appeared first on Earth 911.


